
logo level
SME
Agency
Large enterprise
contactOperationalControl Panel
newsapplication-monitoring

Application Monitoring for Agencies

Websites that load slowly, are temporarily unavailable, or unexpectedly have an expired SSL certificate? As an agency, you sometimes only find out about this when your client reports it. Not only is this annoying, it also undermines trust in your services and those of your hosting partner. That's why we're launching Application Monitoring. A new feature in your control panel that monitors your websites. You can see at a glance how your websites are performing and receive a notification if something goes wrong.

Agency‎‎ㅤ17/07/2025
Application Monitoring for Agencies image

What is Application Monitoring?

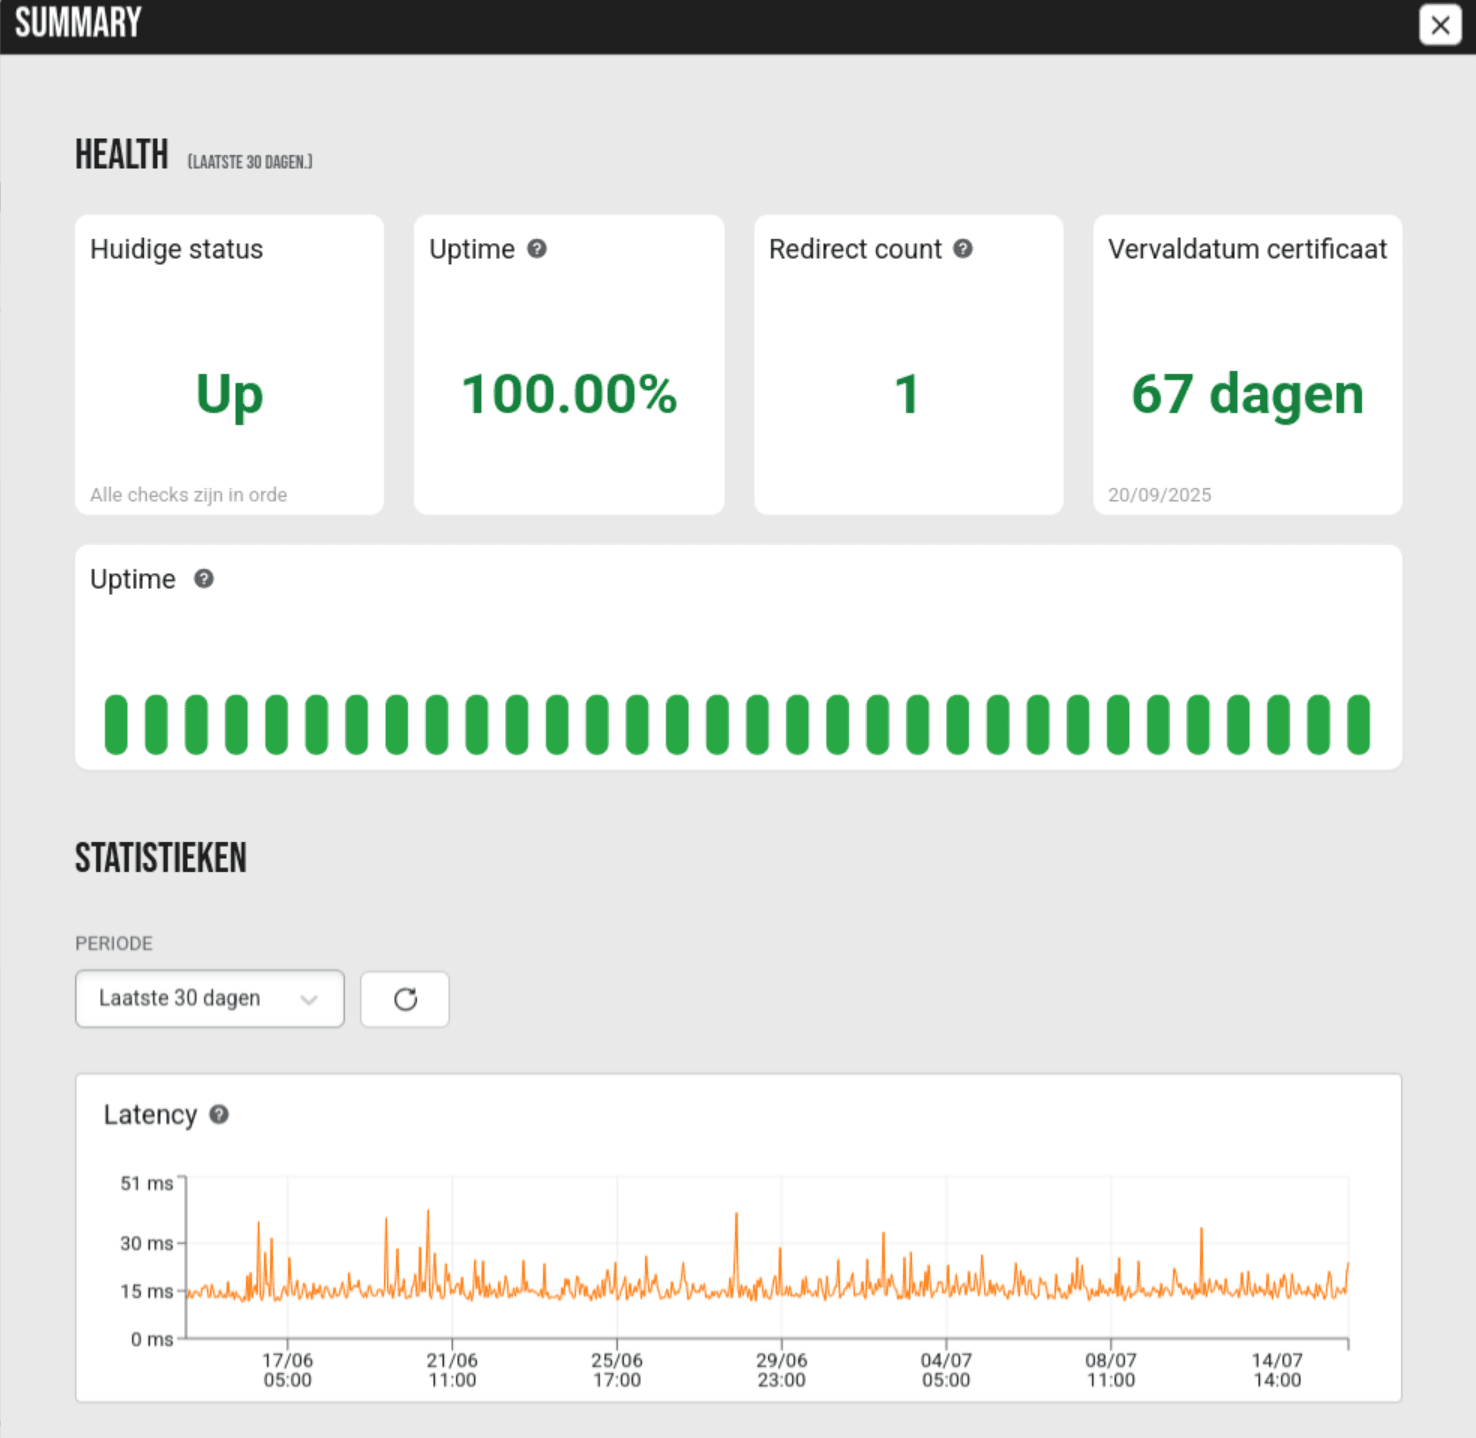
Application Monitoring is a built-in feature in our platform that allows you to track the status of each individual website. No more general server status, but clear insights per project.

We continuously monitor three crucial parameters:

  • Availability: Is your website accessible to visitors?
  • Speed: How quickly does your site respond to a request?
  • SSL status: Is your certificate still valid or does it need to be replaced?

You get a clear overview of performance over the last 30 days. If there are any problems, you will automatically receive a warning via email. This way, you are always the first to know, without your customer having to intervene.

author picture

“With Application Monitoring, you are always aware of the status of your websites, allowing you to act quickly and keep your customers online without any worries.”

Roald

Product Manager

What does this mean for me?

  • Immediate notifications in case of problems
    No more surprises from customers complaining about a slow or unavailable website. You will receive immediate notification in case of downtime, slow loading times, or an SSL certificate that is about to expire.
  • Insight per individual website
    No longer vague server status, but clear data per project. This allows you to take targeted action where necessary, without having to take a guess.
  • Overview of the past 30 days
    With a clear dashboard, you can see trends and performance over a longer period of time. This allows you to recognize patterns and prevent future problems.
  • Time and money savings
    You no longer need to install or manage external monitoring tools. Everything is built into your control panel, always up to date and tailored to your Agency Hosting environment.
  • Detection of large-scale problems
    Application Monitoring also detects large-scale malfunctions. If a significant portion of the websites in an Agency Hosting environment suddenly becomes unavailable, an alarm is automatically triggered. A Level27 engineer investigates and takes action before you or your customer even notice anything.
  • Track multiple endpoints
    You choose which websites you monitor. This means you always have access to the right data for each project. The number of endpoints you can add depends on your hosting package and grows with your needs.
  • Active follow-up for Platinum customers
    Monitoring notifications from Platinum customers are not only sent to you, but also followed up directly by a Level27 engineer. We analyze the problem and take action ourselves. Is the issue more complex or does it require input from you? Then we will notify you immediately and help you with the analysis. This way, your service always remains at the highest level.

How do you measure the speed of your website?

The speed of your website is influenced by two factors: how quickly the server responds to a request (external) and how efficiently your website processes that request (internal). You can monitor both of these in your control panel.

External speed: latency per phase

Application Monitoring gives you insight into how quickly your website responds from the moment a visitor sends a request. The total response time is divided into separate phases:

  • TLS: Time to establish a secure connection (SSL handshake)
  • Resolve: Time to look up the IP address of your domain name
  • DNS lookup: Time required by the DNS server to convert the domain name
  • Connect: Time to effectively connect to the server
  • Processing: Time required by the server to process the request
  • Transfer: Time to send the data back to the browser

This breakdown allows you to immediately see where the delay is occurring: in your connection, infrastructure, or backend.

Internal speed: performance of your application

In the Performance section of your project, you can monitor how well your website is performing internally when a request comes in. Here you can see:

  • Latency: Total time your application needs to process a request
  • Throughput: Number of transactions per minute (tpm)
  • CPU: Consumption of computing time on the server
  • Memory: How much memory your project uses
  • Disk: How much disk space is read or written
  • Failed: Percentage of failed transactions
  • Breakdown: Breakdown of transactions by type (visible once enough data is available)

Why this matters to your agency

Application Monitoring provides your agency with a powerful tool that helps you keep a close eye on your websites at all times. No more unexpected complaints, no more unnoticed problems, but real-time insight and immediate notifications in the event of malfunctions. This not only makes it easier to act quickly, but also strengthens your position as a reliable partner for your customers. Thanks to this feature, you can focus on what really matters: delivering optimal online experiences, without stress or interruptions. This way, you always stay one step ahead and are truly Relaxed Online.

Learn how to use the Application Monitoring tool

Hoe gebruik ik de Application Monitoring tool?

Interesting for you

Stay informed

Subscribe to our newsletter and receive the latest updates on our products and services.

By subscribing, you agree to our privacy policy